Camp Creek Paired Watershed Study · central Oregon
Ecohydrology Lab, Oregon State University

The Ecological and Hydrological Response to Western Juniper Control

Juniper management at Camp Creek resulted in overall improvement in soil, water, and vegetation conditions over time in the treated watershed. Here is what we measured and what we found.

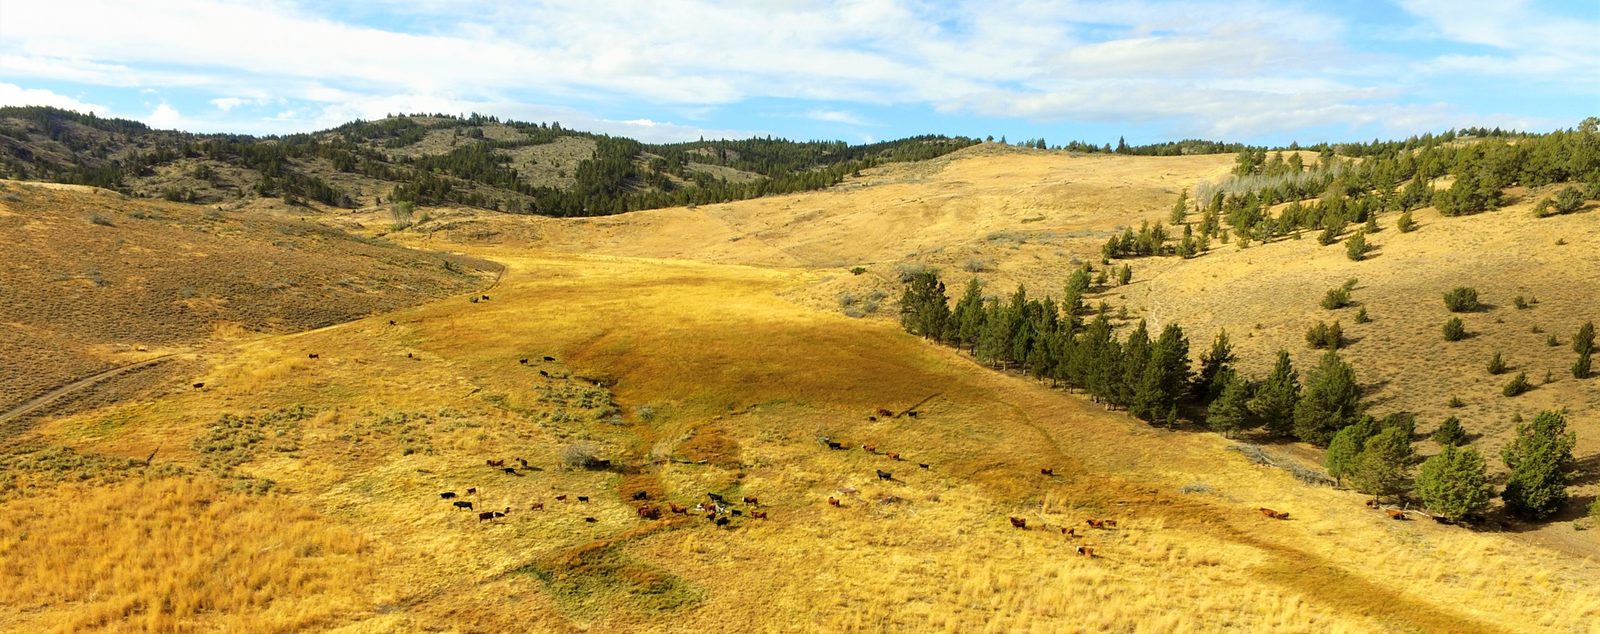
Aerial view of the Camp Creek meadow in golden autumn grass with cattle grazing, sagebrush and bunchgrass hillsides on both sides, and juniper trees on the slopes beyond.
The Camp Creek meadow, where the Jensen and Mays watersheds drain. Photo: OSU Ecohydrology Lab.
Mays: juniper cut in autumn 2005Jensen: left uncut
Quick answers

The two questions we hear most

Key findings at a glance

What 21 years after cutting juniper showed at Camp Creek

Treated watershed (Mays) compared with the untreated one (Jensen). Select a tile to see the chart behind it.

Take-home for land managers

What these findings mean if you are planning a juniper cut

Looking ahead

Keeping the gains, and answering the bigger questions

Why juniper matters

Juniper has spread across Oregon's rangelands

Western juniper (Juniperus occidentalis) once grew mostly on rocky ridges and rimrock, where fire seldom reached. Over the last 130 years or so, its range has grown roughly tenfold, from about to around in central and eastern Oregon and adjoining states.

As it spread, vast areas of sagebrush steppe became juniper woodland. That shift changes how water moves through the land, lowers rangeland productivity, and adds to water shortages as the climate grows drier.

The Camp Creek Paired Watershed Study, started in 1994, tests what happens when juniper is removed. Its long record shows lasting gains after the cut: more perennial grass and shrub cover, more herbaceous forage, wetter soil, and more springflow and streamflow.

Western juniper range
about 130 years ago
today

Roughly a tenfold increase. Bars drawn to scale. Source: Miller et al. 2005, OSU Agricultural Experiment Station Technical Bulletin 152.

About the project

Two neighboring watersheds, one cut and one left alone

A paired watershed study watches two similar, side-by-side drainages for years. Then one is treated and the other is not. Because both get the same weather, the difference between them after treatment shows what the treatment did.

At Camp Creek, Mays watershed had about of its western juniper canopy cut in 2005, measured from aerial photos taken before and after the cut.Jensen next door was left as it was. Before the cut, both had about the same number of mature junipers ().

The two watersheds have been continuously monitored for multiple soil, water, and vegetation variables since the beginning of the project in 1994. Learn more at ecohydrology.oregonstate.edu.

How a paired study works: same weather, one change, compare what flows out of each watershed's outlet.

The study site and instrumentation

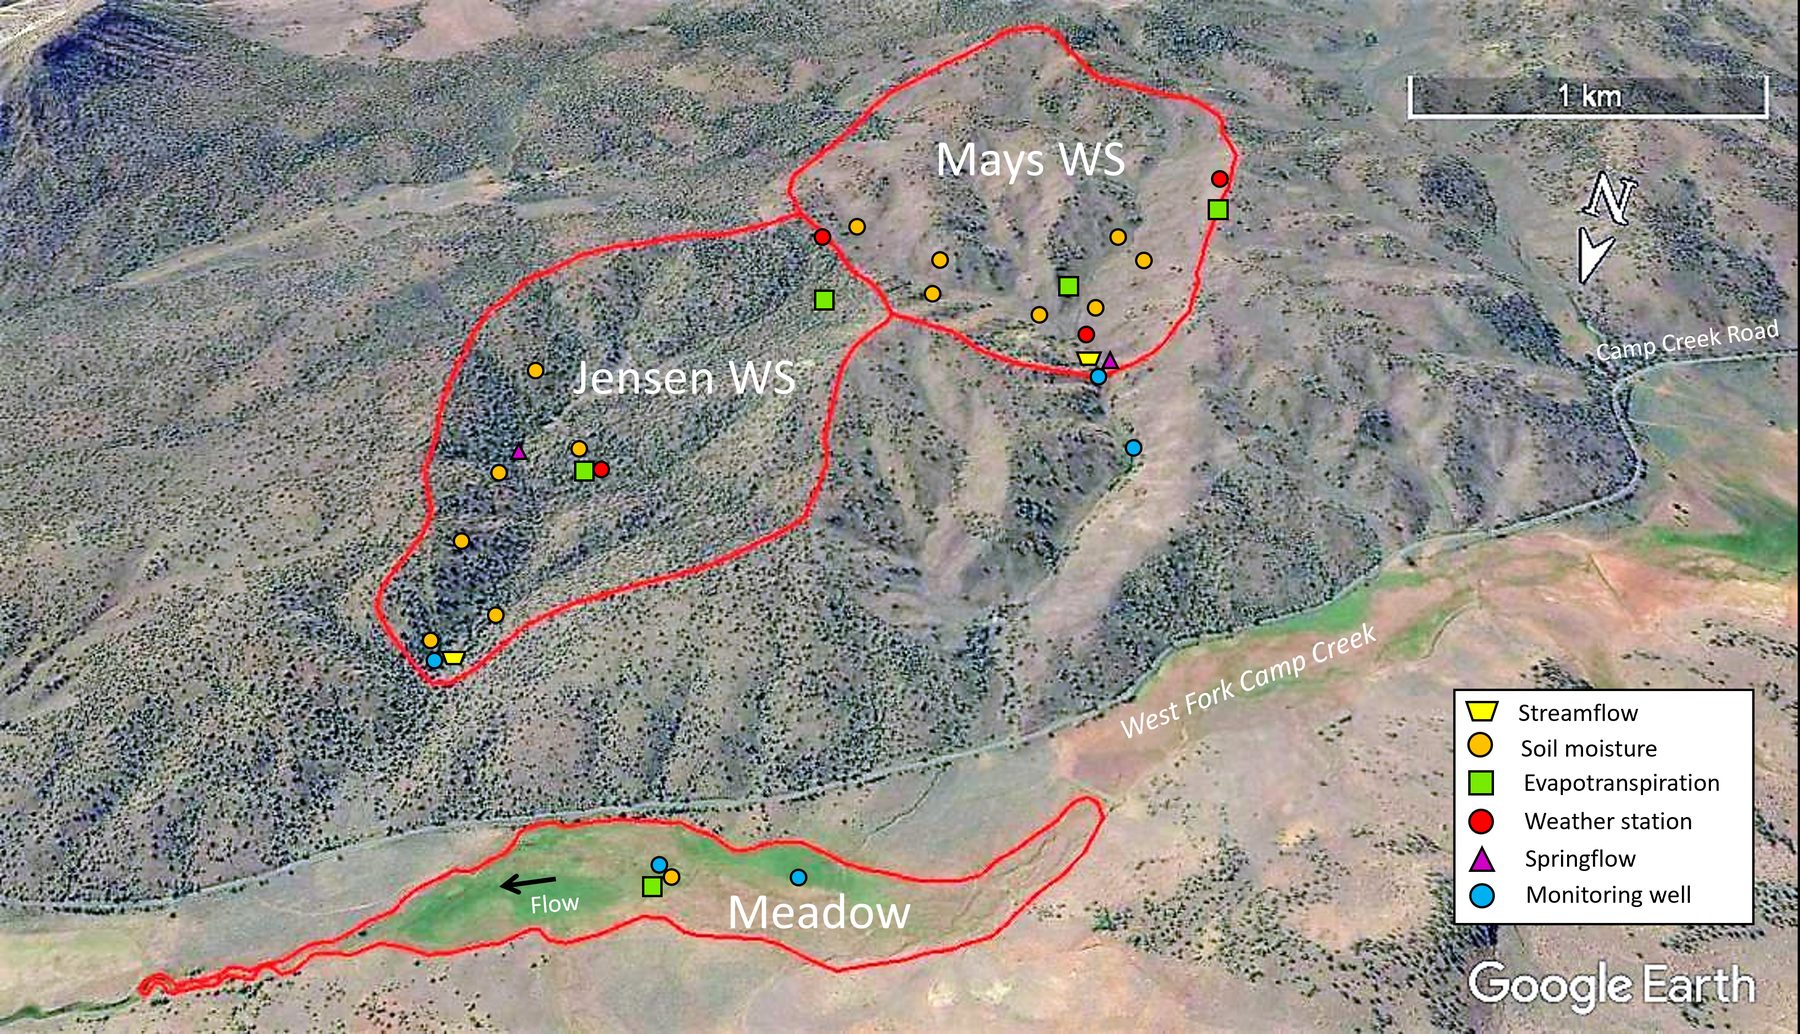
Aerial view of the Jensen and Mays watersheds, outlined in red, above West Fork Camp Creek and Camp Creek Road, with a riparian meadow outlined below. Symbols mark streamflow gauges, soil moisture stations, evapotranspiration stations, weather stations, springflow and monitoring wells. Scale bar 1 km.
Jensen (uncut) and Mays (cut) drain toward West Fork Camp Creek and the meadow below. Symbols mark the streamflow gauges at each watershed outlet, soil-moisture stations, evapotranspiration stations, weather stations, springflow sites and monitoring wells, including the wells and stations in the meadow. Imagery: Google Earth.
A systems approach

From hilltop to aquifer to valley

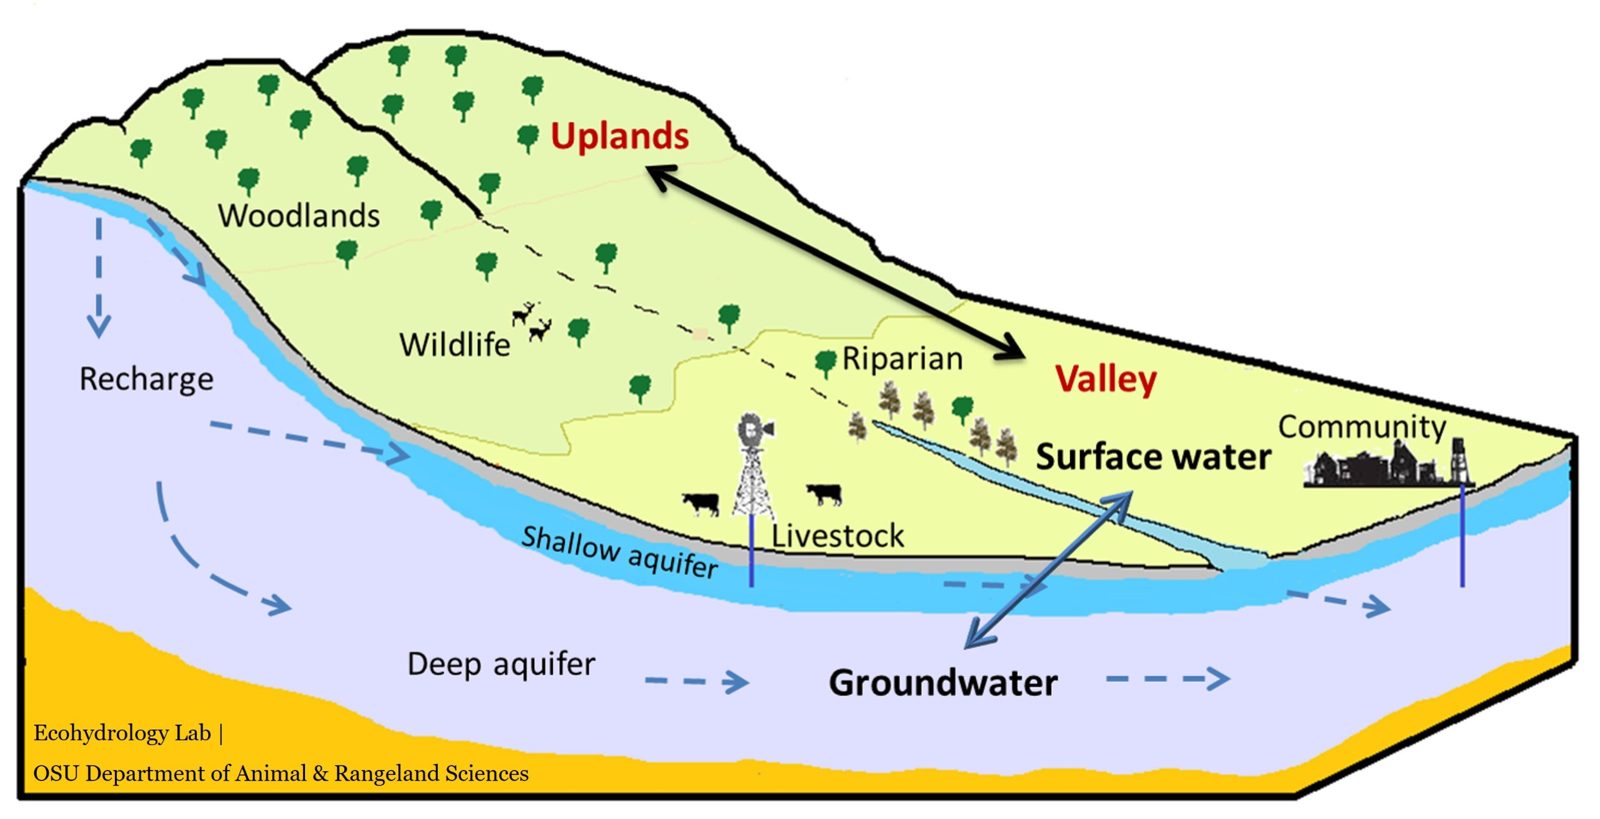
We study each watershed as one connected system. What grows on the uplands changes how much rain and snowmelt soaks into the soil, how much recharges the shallow and deep aquifers, and how much reaches springs and the stream in the valley.

Cross-section of a watershed: juniper woodlands on the uplands with wildlife, a valley with riparian trees, livestock, a windmill well and a community. Arrows show recharge from the uplands into a shallow aquifer and a deep aquifer, groundwater moving toward the valley, and two-way exchange between groundwater and surface water.
The uplands, valley, surface water and groundwater work as one system. Diagram: Ecohydrology Lab, OSU Department of Animal and Rangeland Sciences.
Mays, 2005 to 2026

From juniper woodland to sagebrush and grass

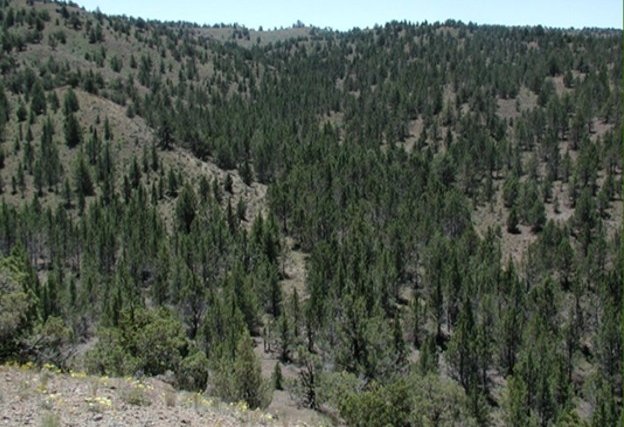
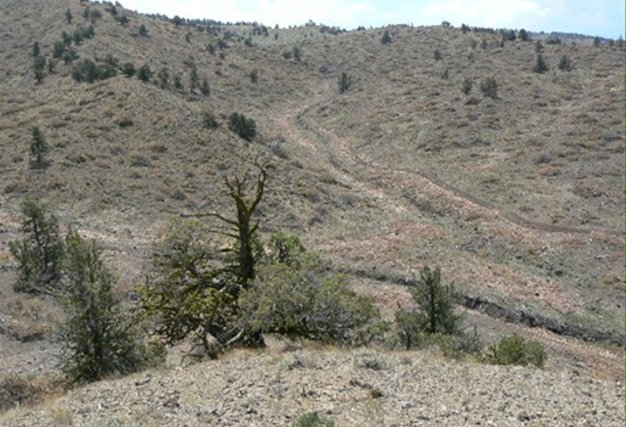
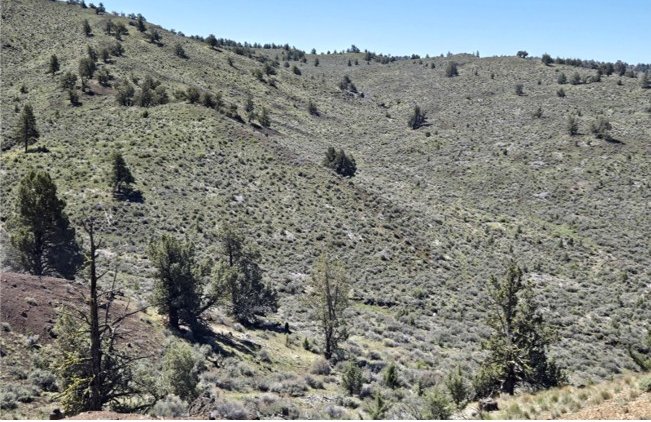
The same view of the Mays watershed before the cut, two years after, and 21 years after.

Mays watershed before treatment: hillsides densely covered with western juniper, bare soil between the trees.2005 · before the cut
Before the cutJuniper covered the hillsides, with bare ground between the trees. Photo: Tim Deboodt, Crook County.
Mays watershed two years after treatment: the same hillsides with most junipers gone, cut trees lying on the slopes, and sparse low vegetation.2007 · 2 years after
Two years afterMost junipers are gone. The cut trees lie on the slopes, and grass and shrubs are only starting to fill in. Photo: Tim Deboodt, Crook County.
Mays watershed 21 years after treatment: the same hillsides covered in sagebrush and green grass, with scattered junipers.2026 · 21 years after
21 years afterSagebrush and grass cover the slopes. Scattered junipers remain, some left at the cut and some that have grown back.

From the air: before and after the cut

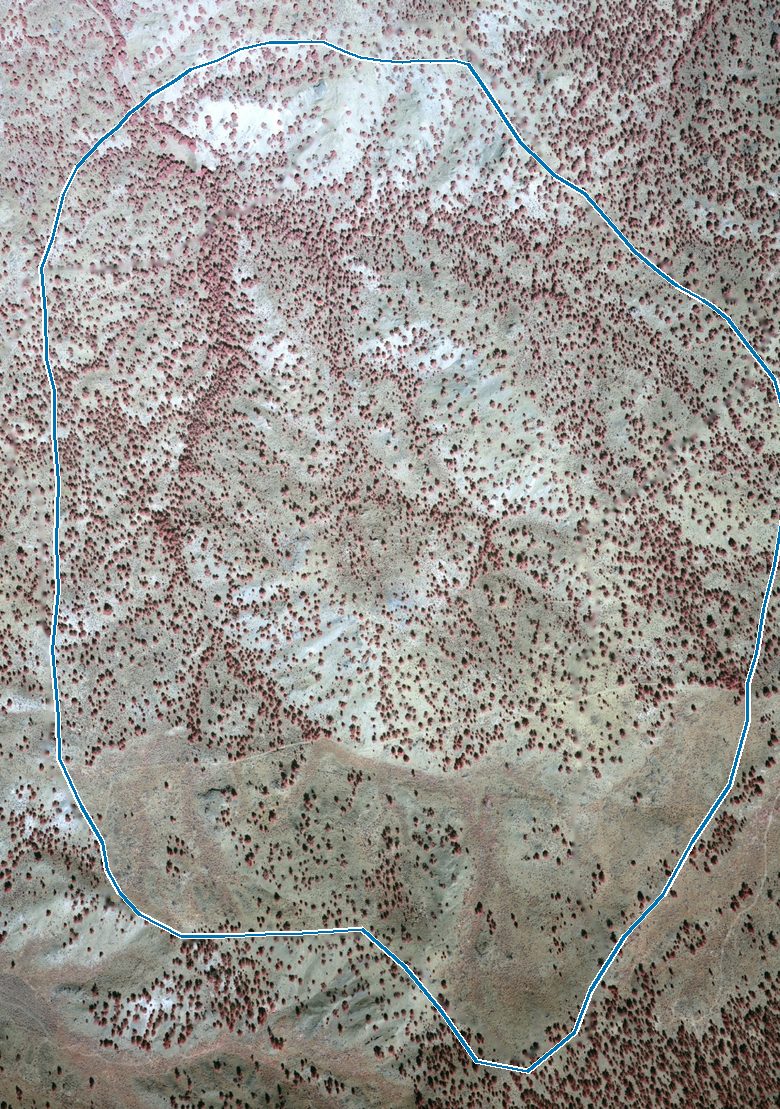
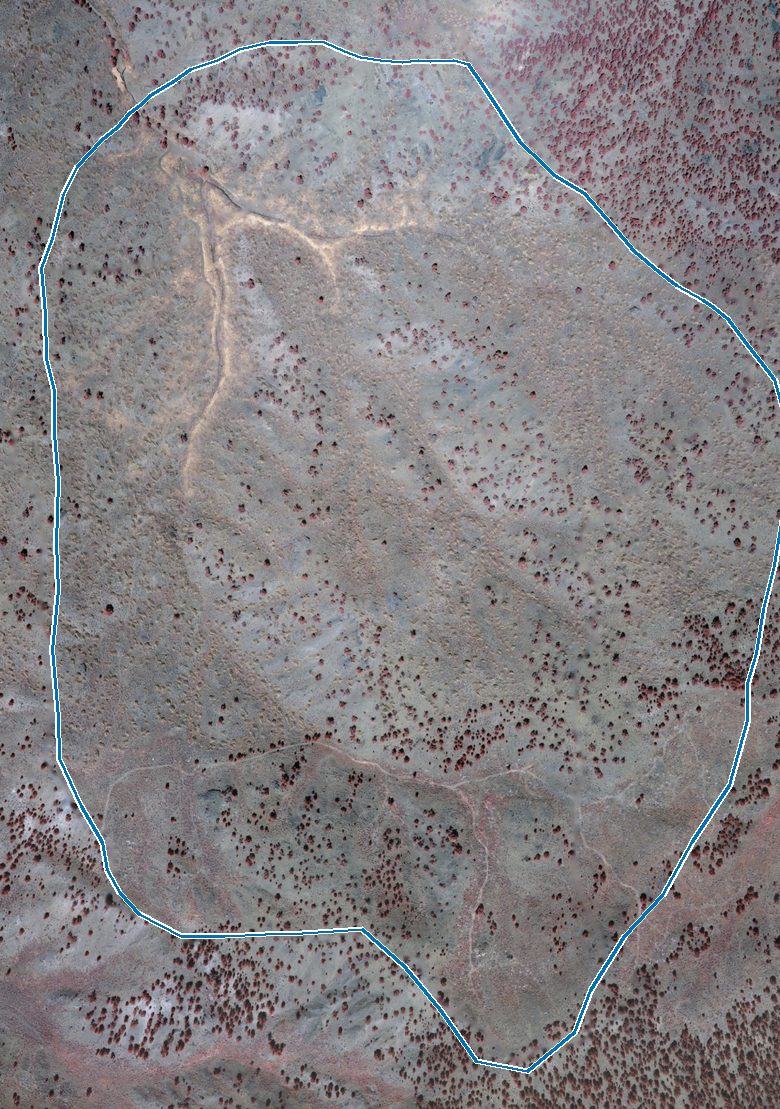
Color-infrared aerial photos of Mays, north at the top, with the watershed boundary in blue. Live junipers show as dark red. The outlet is at the top; the upper slopes are at the bottom. Aerial photos: Tim Deboodt, Crook County.

Color-infrared aerial photo of the Mays watershed in 2004, outlined in blue: dark red juniper crowns cover most of the slopes, densest in the northern half and along the main draws.2004 · before the cut
Before the cutJuniper crowns covered about of the ground, most densely in the northern half and along the draws. Flown 6 September 2004. Photo: Tim Deboodt, Crook County.
The same view in 2006, after the autumn 2005 cut: most of the northern half is now grey-green with few red crowns and pale lines along the draws; the upper slopes at the bottom still hold scattered red junipers.2006 · after the cut
After the cutCrown cover dropped to about , roughly less than in 2004. Most trees came out of the northern half. The southern upper slopes kept theirs on purpose: those old-growth junipers were not part of the cutting plan. Flown 18 August 2006. Photo: Tim Deboodt, Crook County.

Cut and uncut today

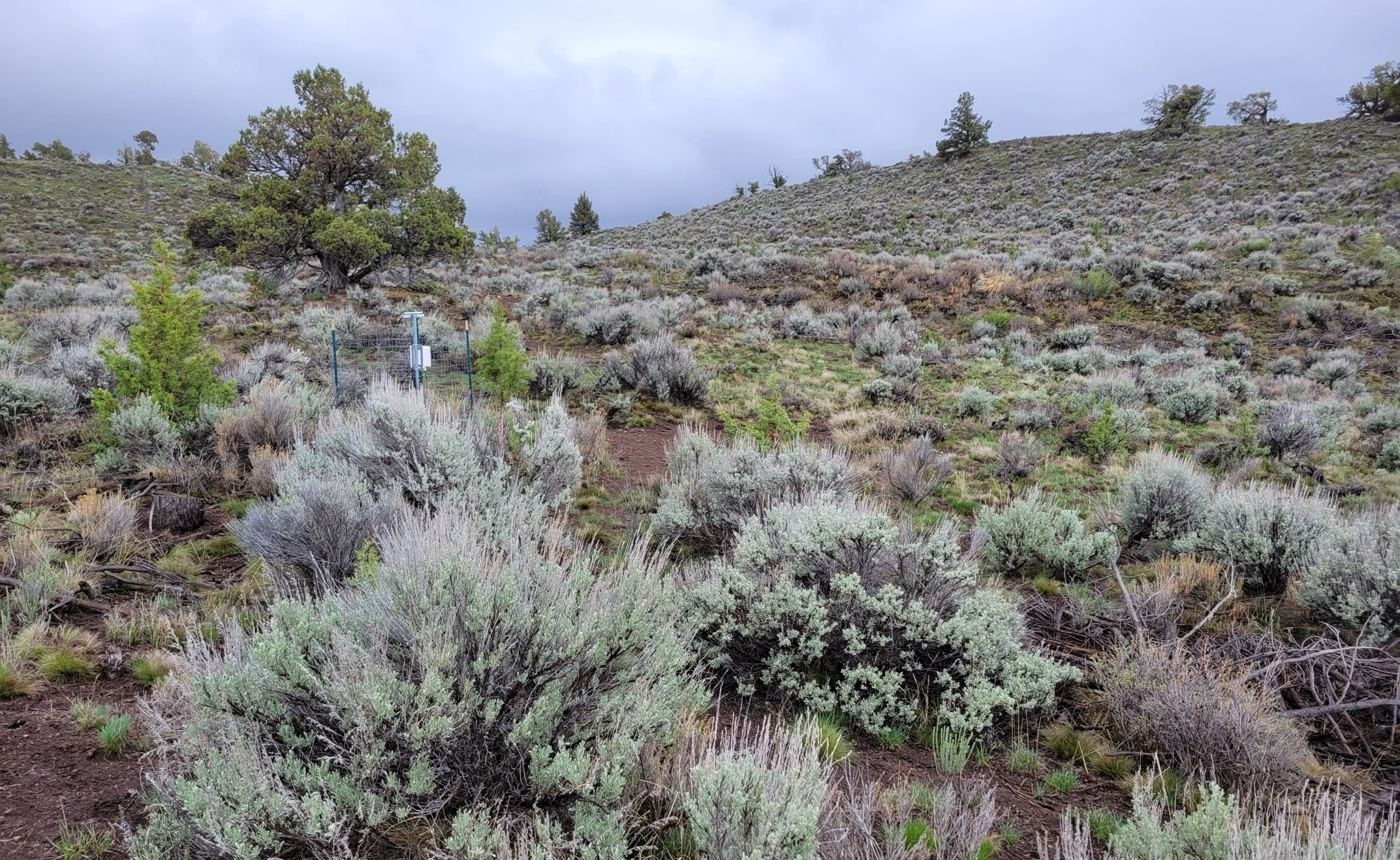
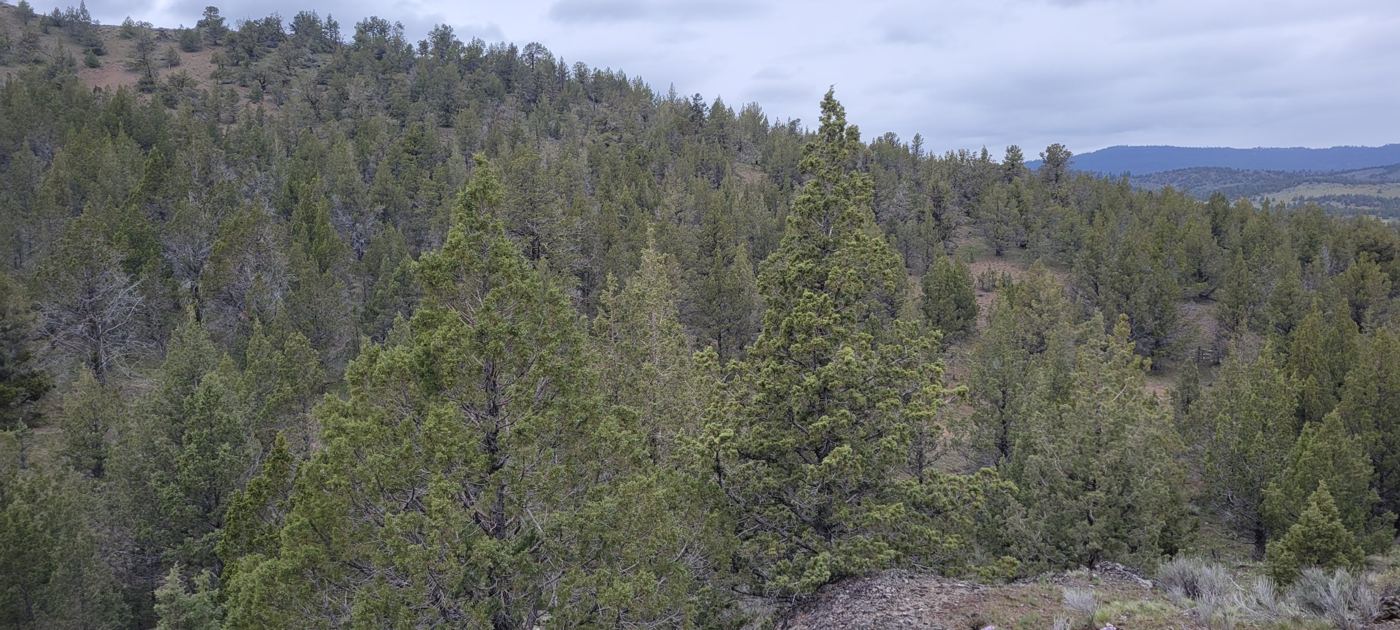
Two decades after the cut, Mays and its uncut neighbor Jensen look very different.

Mays watershed: open hillside of sagebrush and green bunchgrass with bare red soil between shrubs, a fenced soil-sensor station, one large old juniper, a few small young junipers, and scattered junipers on the ridge.Mays · cut in 2005
Sagebrush and bunchgrass now cover the slope. A few old junipers were left standing, and young junipers are coming back. The fenced post is a soil-moisture station.
Jensen watershed: a hillside closed in by dense western juniper trees, with little shrub or grass cover visible between them.Jensen · uncut
Western juniper still fills the hillside, with little sagebrush or grass between the trees.

Photos: OSU Ecohydrology Lab.

What we measured

Five kinds of field records

What we found

Juniper water use, where the water goes, and what changed after the cut

How much water does western juniper use?

From a single tree to a whole stand

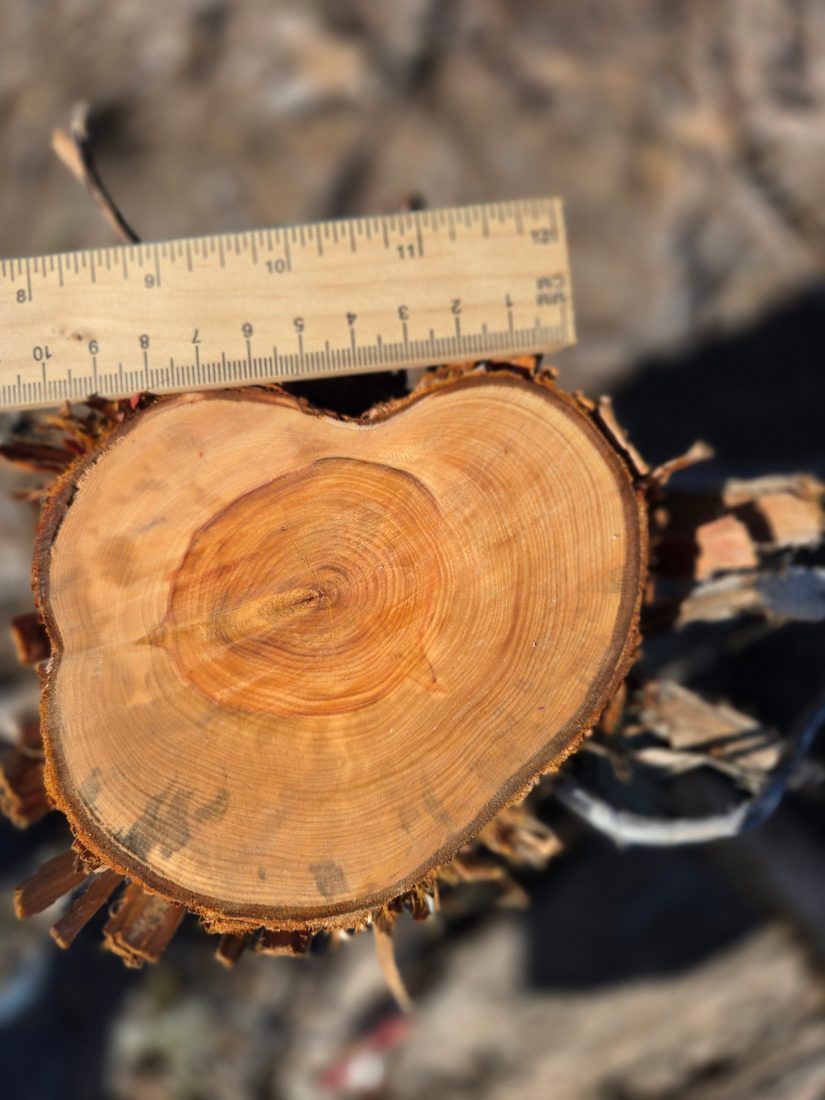
Cross-section of a small juniper stem next to a ruler, about 4 by 4.5 inches across, with tightly packed growth rings and red heartwood at the center.
A small juniper, 4 by 4.5 inches at the base, about 40 to 50 years oldSmall stems can be older than they look: the growth rings are packed tightly together.
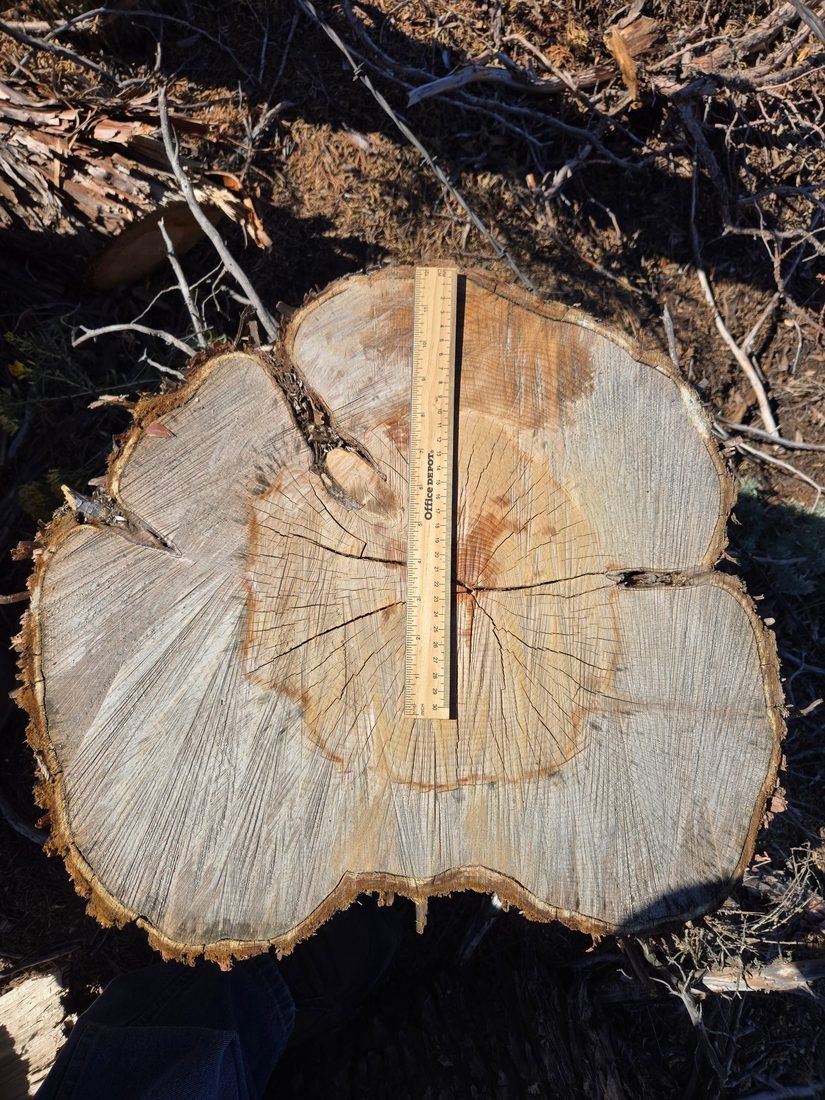
Cut stump of a large juniper with a 12-inch ruler laid across it; the stump is about 17 by 20 inches across, with a pale outer sapwood ring and darker heartwood.
A large juniper, 17 by 20 inches at the base, about 135 to 145 years oldThe 12-inch ruler covers well under the full width of the stump.
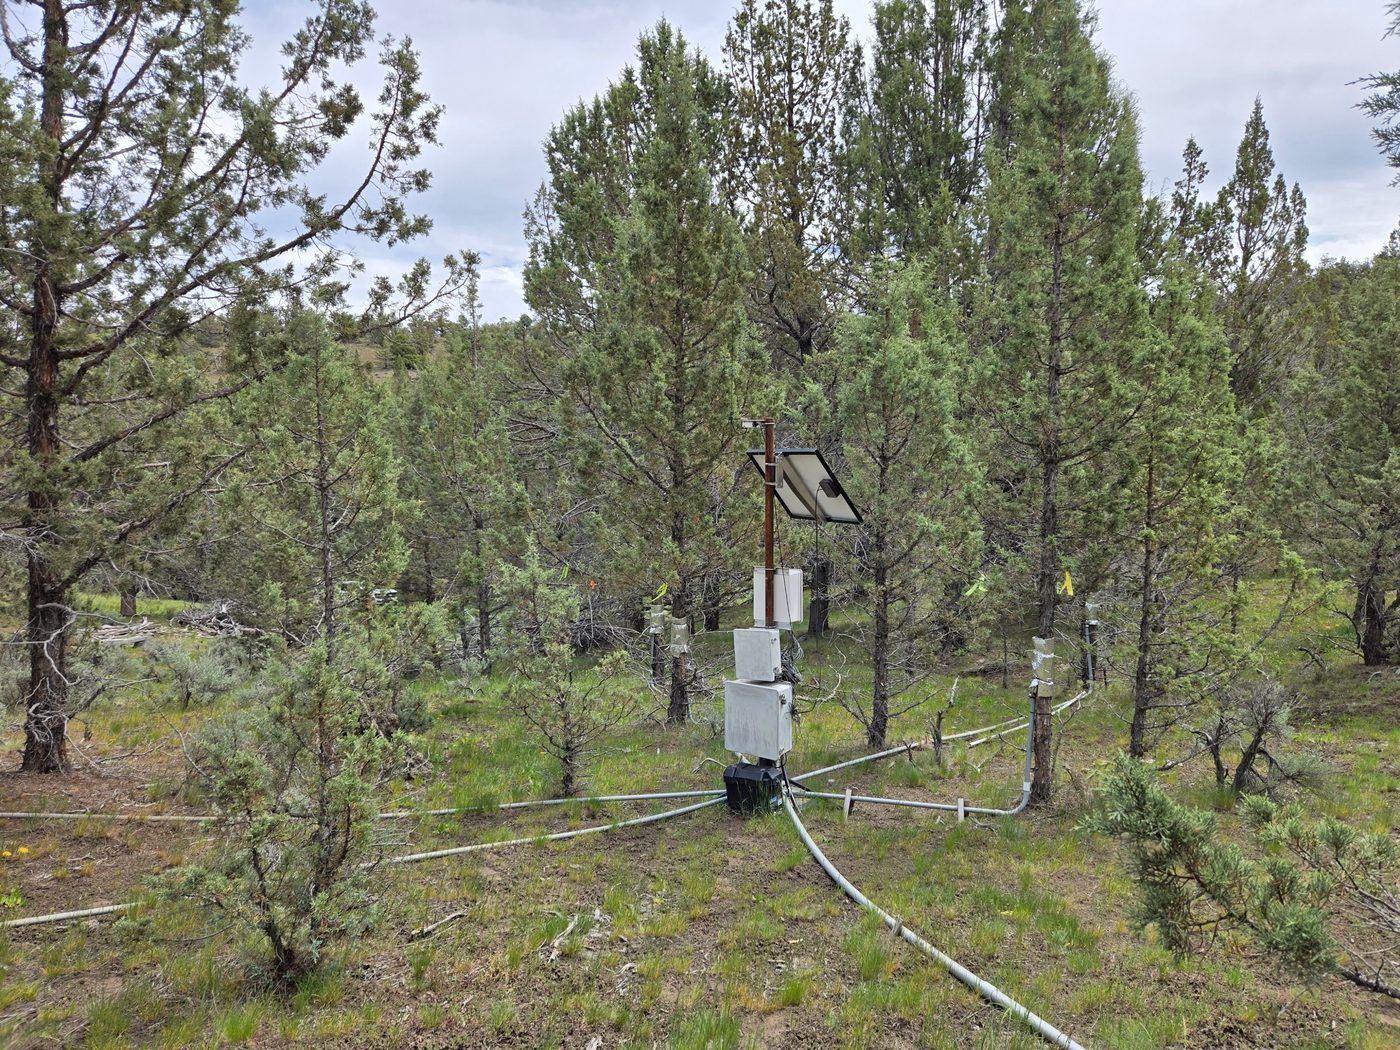
A juniper stand of saplings and mature trees with a solar-powered data logger at the center; gray conduits run to sensors wrapped on the trunks of several trees.
Measuring tree water useSap-flow sensors on saplings and mature trees, logged with precipitation, canopy interception, soil moisture and soil temperature.

The two cut trees came from a neighboring watershed in Camp Creek and were cut in September 2026, at the base. Approximate ages are based on tree-ring counts from enhanced images; the exact number of rings still has to be verified under a microscope. Photos: OSU Ecohydrology Lab.

Water use by tree size

Sap-flow sensors and published studies

Camp Creek sensor treePublished studyAverage tree in each size classFitted curve

Each point is the yearly water use of one tree or group of trees against its trunk diameter at the base. Water use climbs steeply with size, so a few big trees use far more water than many saplings.

Under the canopy: interception and soil moisture

Jensen watershed (uncut), Abdallah et al. 2020
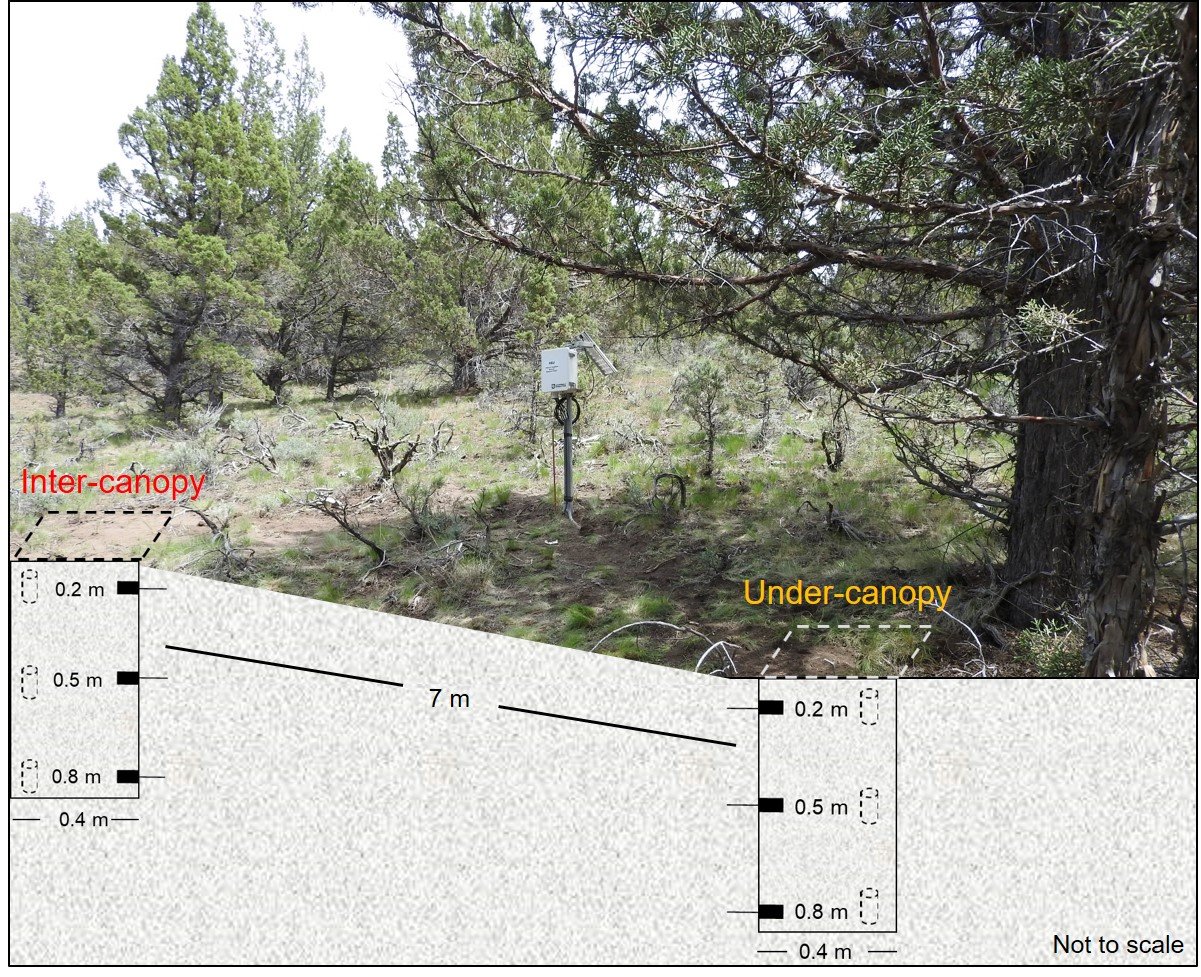
Photo of a mature juniper and a data logger at the Jensen valley site, with a drawing of two soil-moisture sensor columns at 0.2, 0.5 and 0.8 meters deep: one under the tree canopy and one between canopies, 7 meters apart. Not to scale.
Where does the water go after junipers are cut?

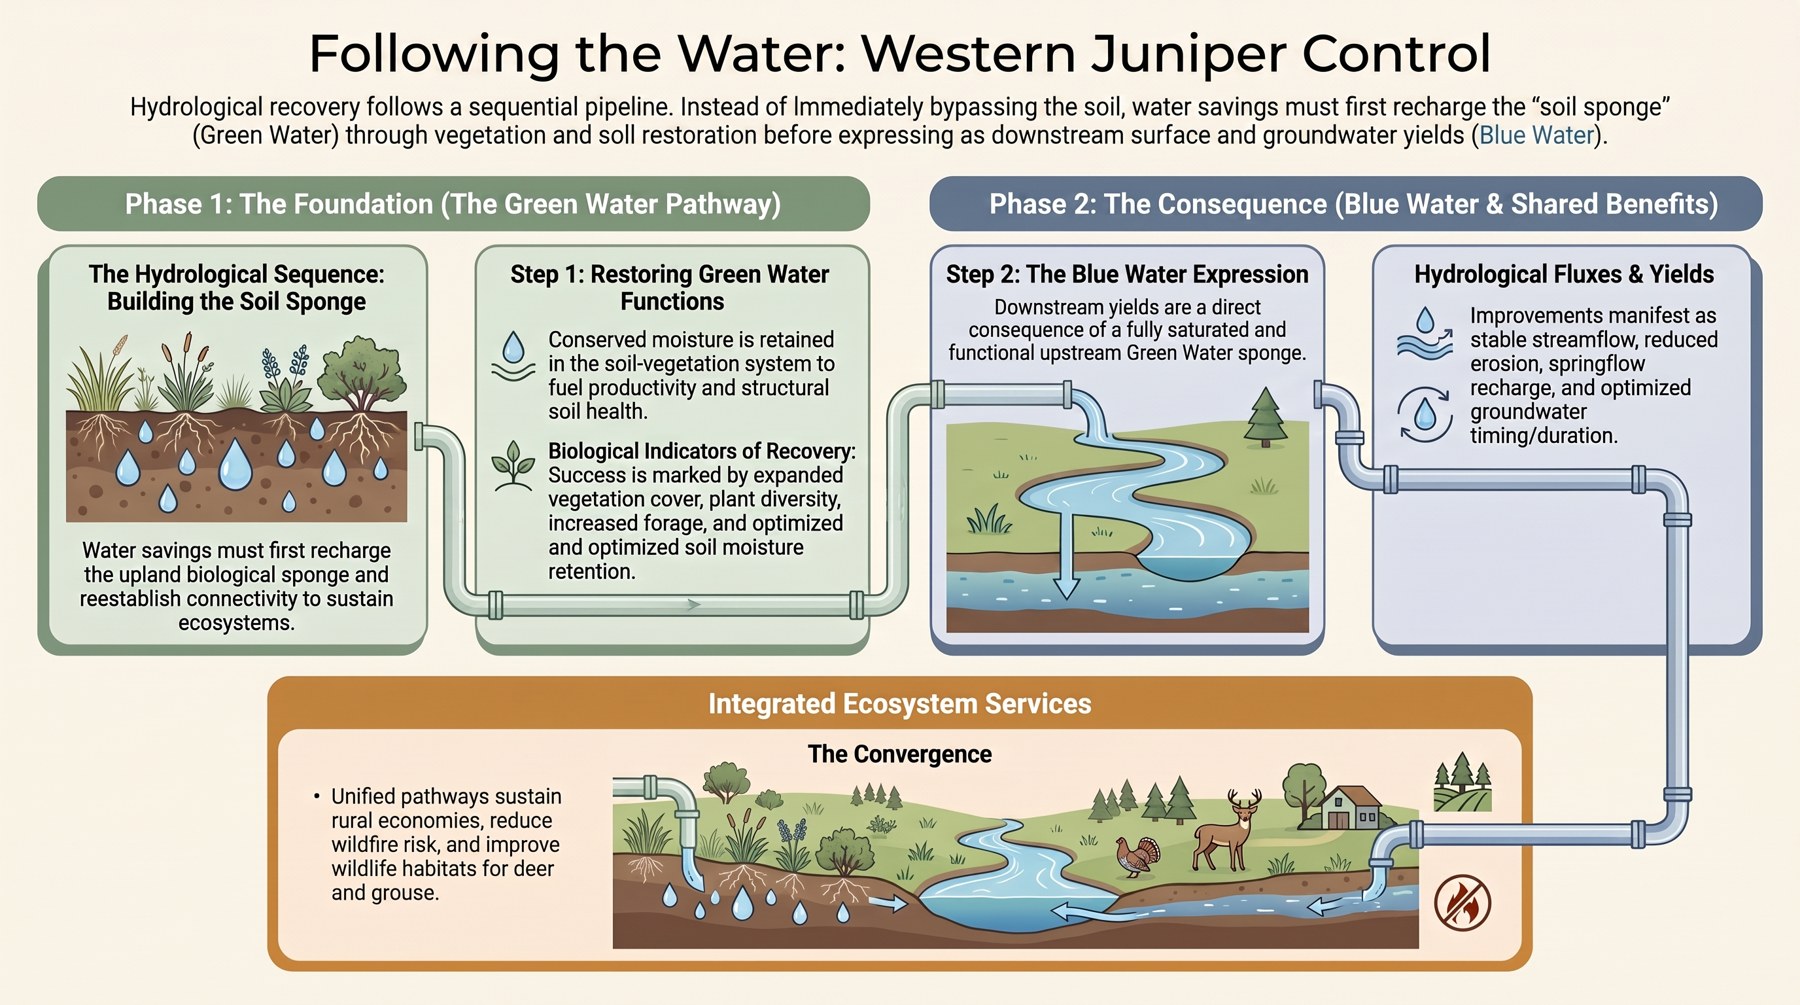
Green water first, then blue water

Infographic titled Following the Water: Western Juniper Control. Phase 1, the green water pathway: water savings first recharge the soil sponge and support plant cover, diversity and forage. Phase 2, blue water: once the soil is recharged, the gains show up as streamflow, springflow and groundwater recharge. A bottom panel shows shared benefits for rural economies, wildfire risk and wildlife habitat.
Green water (soil and plants) comes before blue water (streams and groundwater). Graphic: Ecohydrology Lab.

Juniper keeps water from reaching the soil in two ways. Its dense canopy catches rain and snow, which then evaporates straight back to the air: on two Jensen plots the canopy caught 36 to 46% of what fell (Ochoa et al. 2018). And as an evergreen, it draws water from the soil whenever conditions allow, not only during the main growing season.

When the juniper is cut, both of those losses stop, and the water that is freed up can take two broad paths.

Green water is water that stays in the soil and is used by plants. It goes first, because the dry soil under juniper acts like a sponge that must fill up before anything moves on. It shows up as wetter soil, more grass, forbs and sagebrush, and more forage. Some of it also returns to the air through the new plants and from the bare, warmer soil.

Blue water is water that moves past the root zone. Once the soil sponge is full, the extra drains deeper to recharge groundwater, feeds springs, and reaches the stream. This happens mostly in normal and wet years, when there is enough water to fill the soil first.

How the freed-up water splits between these paths depends on the year's weather, the soil and geology, how much juniper was removed, and how fast new plants fill in. At Camp Creek we saw both: wetter soil and more grass in every year, and extra streamflow mainly in normal and wet years.
Key findings

What changed after the cut

Each card compares Mays (cut) with Jensen (uncut). Open "More detail" for the numbers behind it.

Soil

More water in the root zone every summer

Mays (cut)Jensen (uncut)
More detail
Plants

More grass and other herbaceous plants

Mays (cut)Jensen (uncut)
More detail
Water

Extra streamflow depends on the year

Average extra streamflow on Mays○ A single year
More detail
Explore the long-term record

Three decades of measurements, 1994 to 2026

Hover or tap a point for its value, or open "View these values as text" under any chart. Every chart follows the English / Metric units switch at the top of the page.

Streamflow from each watershed, 1995 to 2026

Flumes at the watershed outlets

Long-term climate, 1980 to 2025

Gridded weather record for the site (gridMET)

Yearly precipitationPeak air dryness (VPD)Long-term trendStudy years (1994 on)

Vapor pressure deficit (VPD) measures how strongly the air pulls water from plants and soil; higher means thirstier air. Trend lines use the Sen slope, a fitting method that single extreme years do not distort.

Soil moisture and drought

Mays (cut)Jensen (uncut)◇ 2025 Jensen estimatedSevere droughtDrier than normalWetter than normal

Top: average soil moisture from May to September, as a percentage of soil volume. "Whole profile" averages the sensors at 20, 50 and 80 cm (8, 20 and 31 in); "top 50 cm" averages the 20 and 50 cm sensors, the root zone of most grasses and shrubs. Bottom: drought index for the same years, where bars above the line mean drier, hotter years and bars below mean wetter years. Jensen sensors were offline for part of 2025, so that point is an estimate.

Grass and forb production by year

Dry weight of clipped grasses and forbs. In the first view, the number above each year is how many times more grew on Mays than on Jensen; the second view shows the extra amount on Mays.

Sagebrush and juniper cover over time

Field plots only, 1995 to 2026

Mays, cut in 2005

Jensen, uncut

What's next

Keeping the gains: follow-up treatment

Juniper is coming back on Mays: a second treatment is planned

Sapling surveys, 2005 to 2026

Young junipers per hectare on Mays
Sapling heights on Mays, 2018 and 2026
Saplings on Mays20182026

Scaling up

From two small watersheds to much larger ones

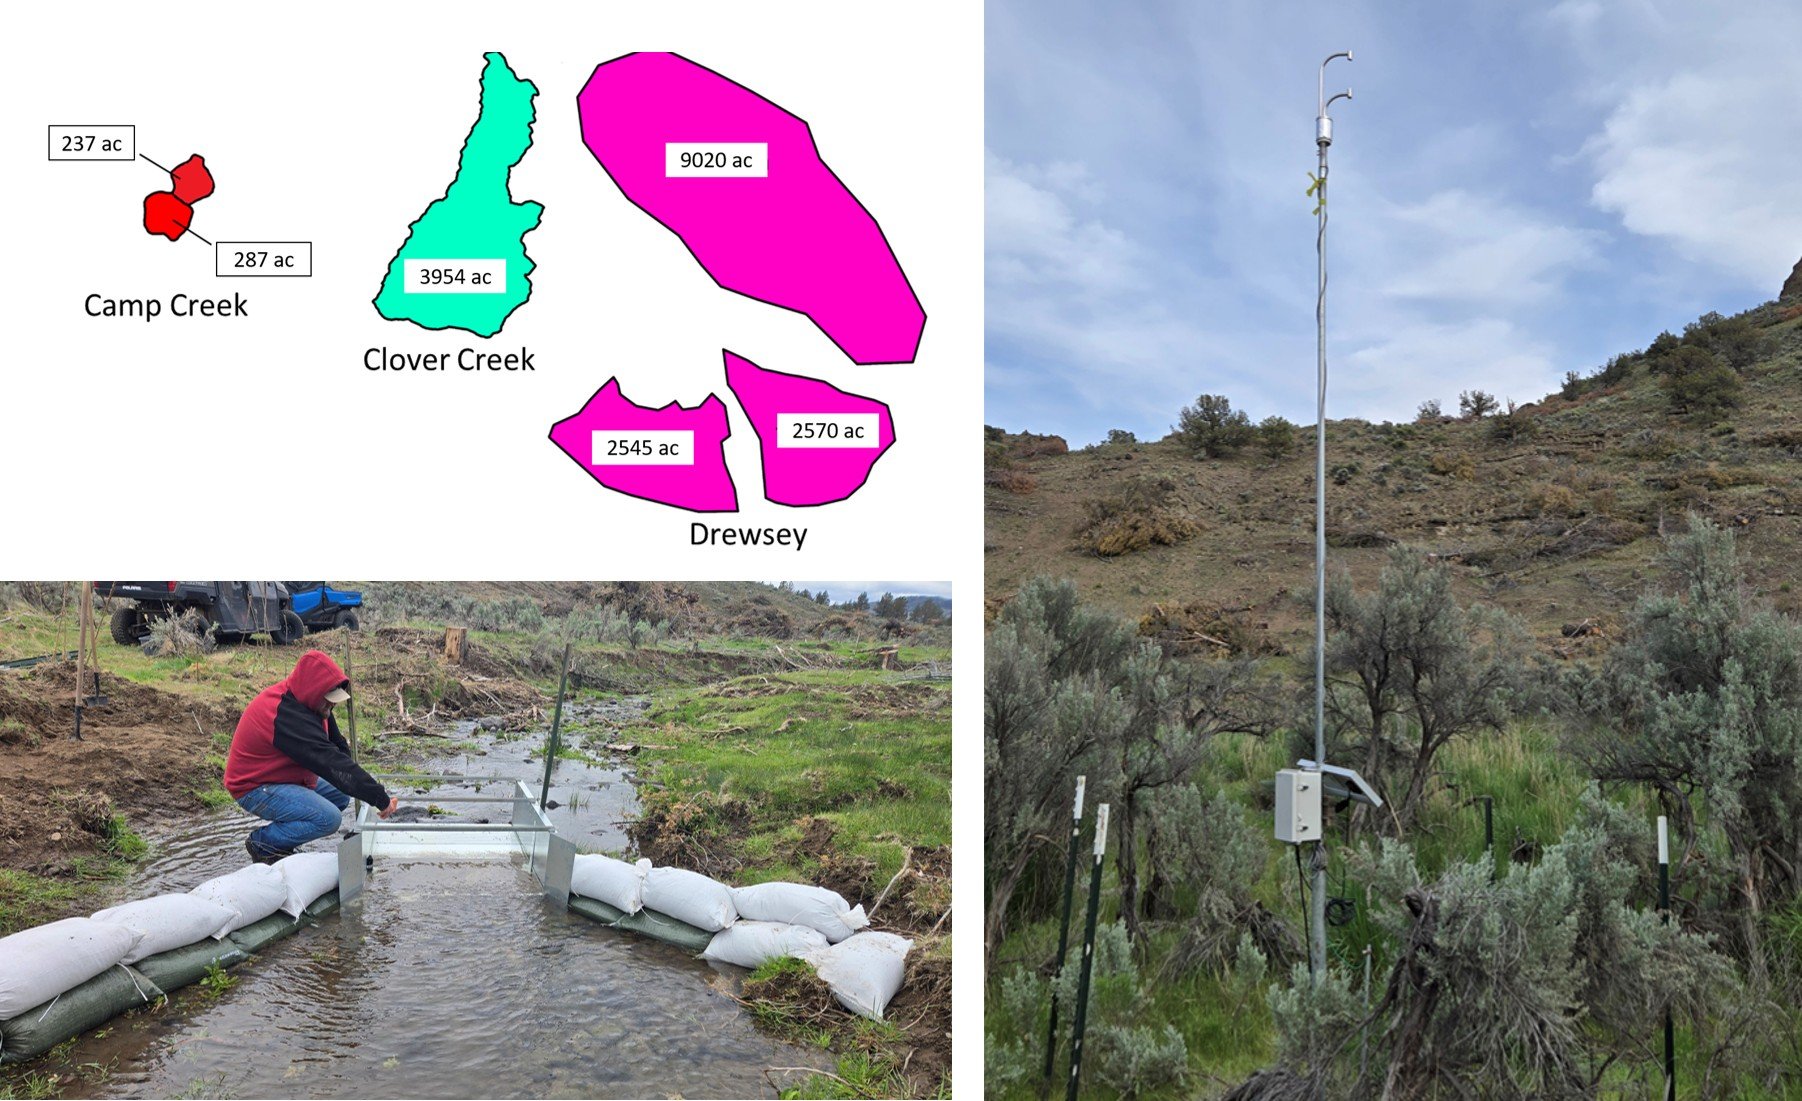
Left top: to-scale outlines of the study watersheds. Camp Creek: 237 and 287 acres. Clover Creek: 3,954 acres. Drewsey: 9,020, 2,545 and 2,570 acres. Left bottom: a stream flume with sandbag walls measuring streamflow at a Drewsey watershed. Right: a tall mast with sensors, a solar panel and a datalogger in sagebrush, measuring evapotranspiration.
Scale of the study sites, drawn to the same scale, with the ongoing streamflow (flume) and evapotranspiration (tower) measurements at one of the Drewsey watersheds.

The two Camp Creek watersheds total about 524 acres (212 hectares). To learn what juniper management does at much larger scales, the lab has extended the approach to central and eastern Oregon. Clover Creek (Crook County) is about 8 times, and Drewsey (Harney County) about 27 times, the size of the two Camp Creek watersheds combined.

These sites let us estimate the effects of juniper management on streamflow and water use at much larger scales, using single-watershed and nested-watershed approaches (smaller watersheds measured inside larger ones). The projects started in 2023 and build on what we learned at Camp Creek.

Contact

Contact information

Ecohydrology Lab logo

Dr. Carlos Ochoa
OSU Ecohydrology Lab, Oregon State University

Photos and figures on this page: OSU Ecohydrology Lab, except the 2004 and 2006 aerial photos of Mays and the 2005 and 2007 views of Mays, which are by Tim Deboodt, Crook County.

ecohydrology.oregonstate.edu · Study publications

Acknowledgments

We want to thank the Hatfield Hyde Land Trust and the U.S. Department of the Interior Bureau of Land Management—Prineville Office for their continuous support of this project and providing access to the field sites. We are also grateful to the multiple students from Oregon State University and volunteers who over the years have participated in the various field data collection activities related to this research. Funding support for this project has come from many different state and federal agencies and organizations over the years. Our most heartfelt thanks go to Doc Hatfield, Tim Deboodt, Michael Fisher, and John Buckhouse, who pioneered the establishment of the long-term CCPWS site in 1993.